
Dashboard Analytics, Reports & Activity Logs
Subscriptions for Shopify Checkout offers a wide range of options to view and analyze your overall subscription information. You can access this information through the Bold Subscriptions' Dashboard and in the settings under Activity Logs.
With Bold Subscriptions, you can:
See snapshots of your churn rate and estimated subscription revenue over a period of time.
Download and view all your subscriber's information in a CSV file.
Review a log of changes made to your customer accounts, subscription settings and more.
Dashboard analytics
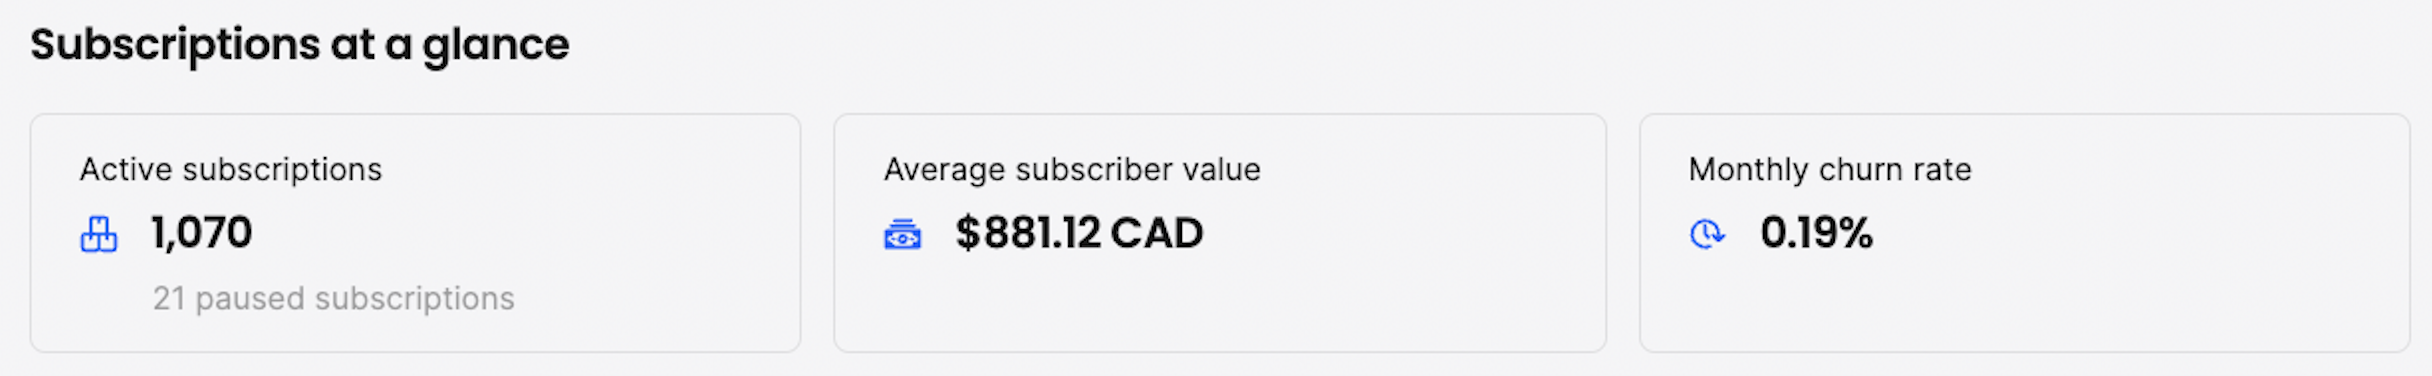
Subscriptions at a glance
At the top of the Dashboard page you can view your Subscriptions at a glance statistics. The Active subscriptions number does not include paused or cancelled subscriptions. Paused subscriptions are shown below, within the same section.
The Active subscription number is the most accurate as it is pulled from the database.
Better Together Metrics (new)
This section shows the impact of pairing Bold Subscriptions with Bold Custom Pricing (CSP). These metrics automatically display when both apps are installed and configured, and at least one active subscription group shares customer tags with Custom Pricing.
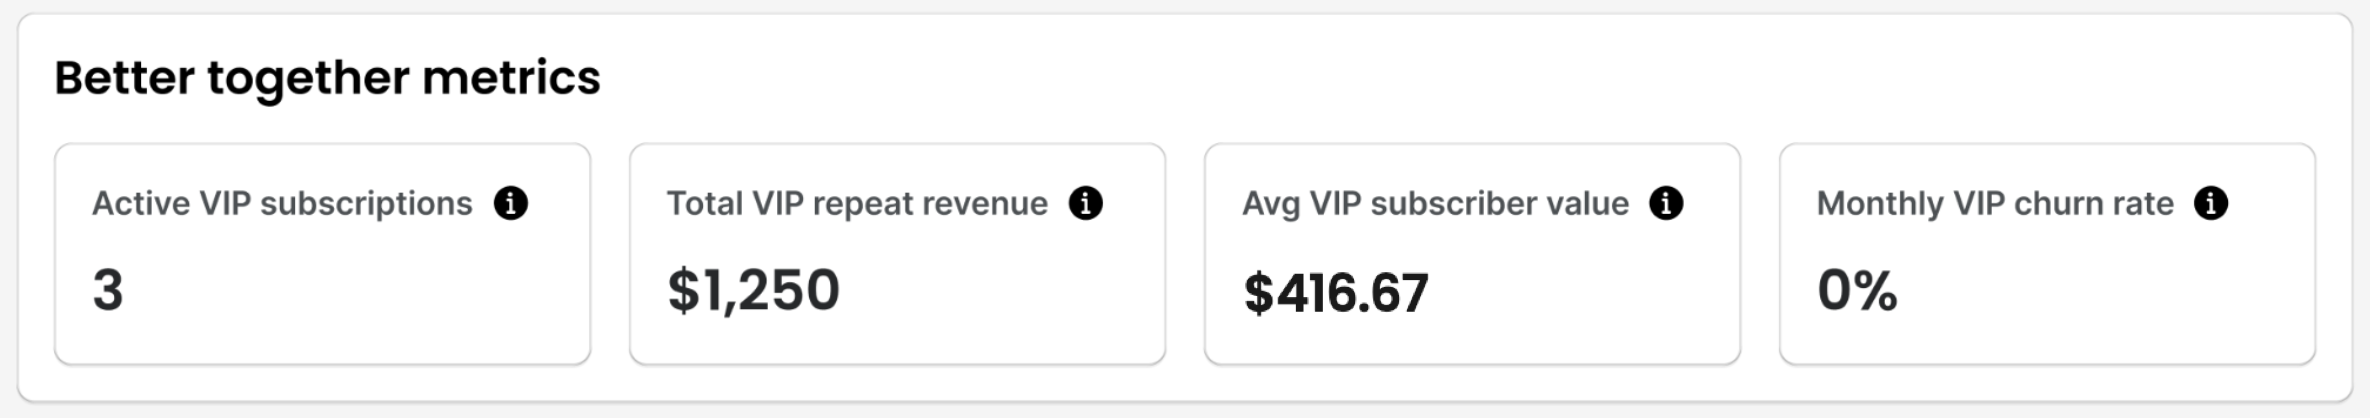
The four metric tiles segment your subscription data by VIP/member tags:
Active VIP subscriptions: Number of active subscriptions currently receiving VIP/member pricing.
Total VIP repeat revenue: Total revenue from repeat orders placed by CSP-tagged subscribers.
Avg. VIP subscriber value: Average revenue generated per CSP-tagged subscriber.
Monthly VIP churn rate: Monthly churn rate specifically for CSP-tagged subscribers.
VIP/member customers are identified by tags present in both apps. Metrics start from the date the matching tag was active in both apps.
To learn more, please visit VIP Member Pricing with Bold Custom Pricing & Bold Subscriptions.
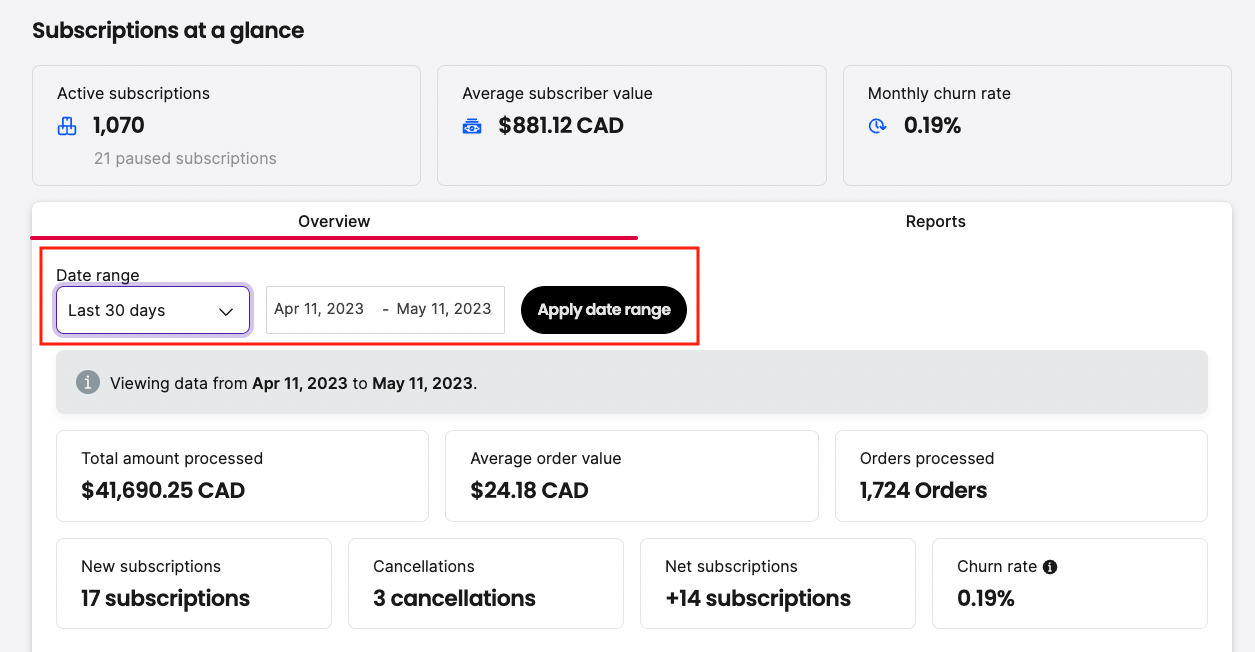
Dashboard Overview
The Dashboard Overview calculates your estimated subscription revenue over a set period of time. Orders that are set to recur are taken into consideration. You can review these stats as soon as you begin using the app, including an overview of your new subscriptions, cancellations, and monthly churn rate.
You can view the statistics for a specific period of time by selecting the Date Range under Overview:
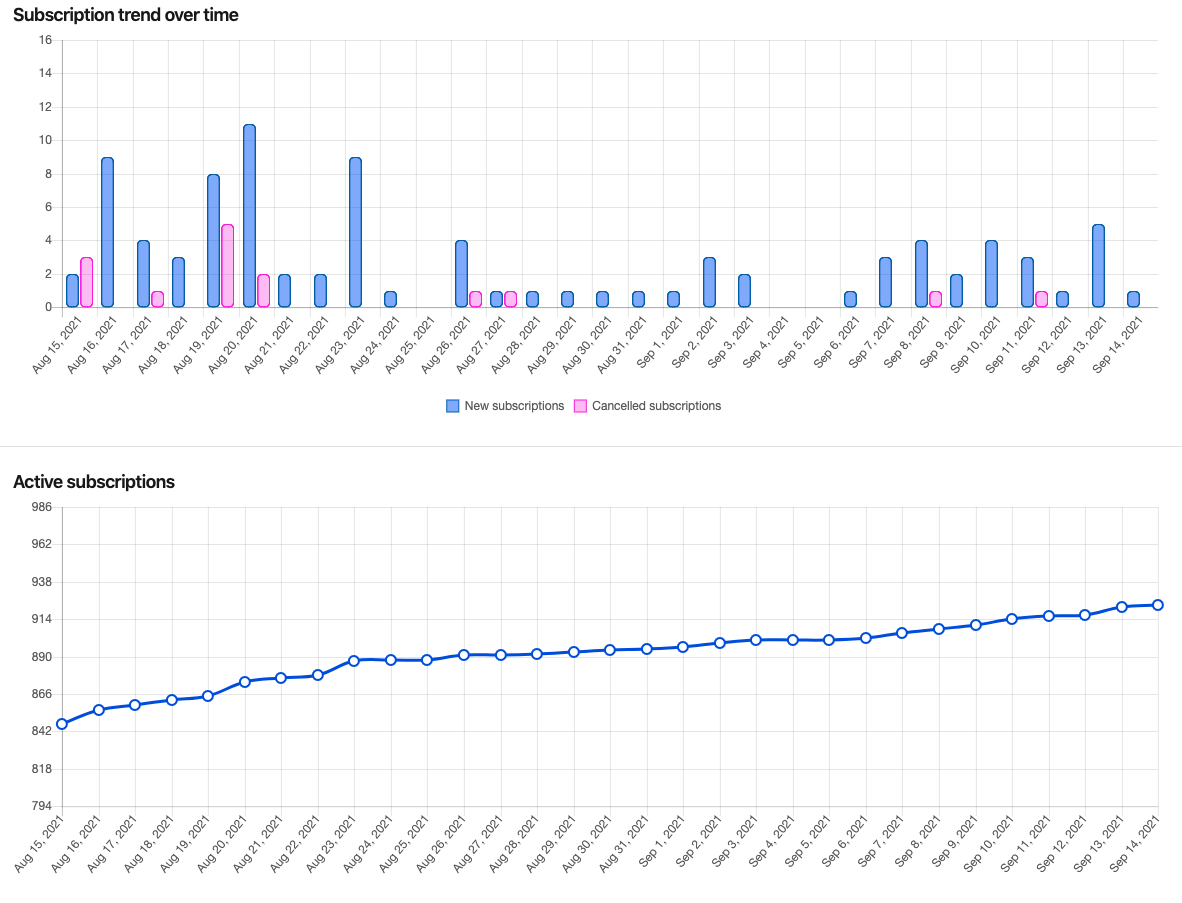
Subscription trends over time
Under Subscription trend over time, you can view your trends over time as well as a snapshot of your active subscriptions.
This count may not be 100% accurate as it is calculated from the activity log. This can cause discrepancies when there are changes to a subscription status that are not logged in the activity log.
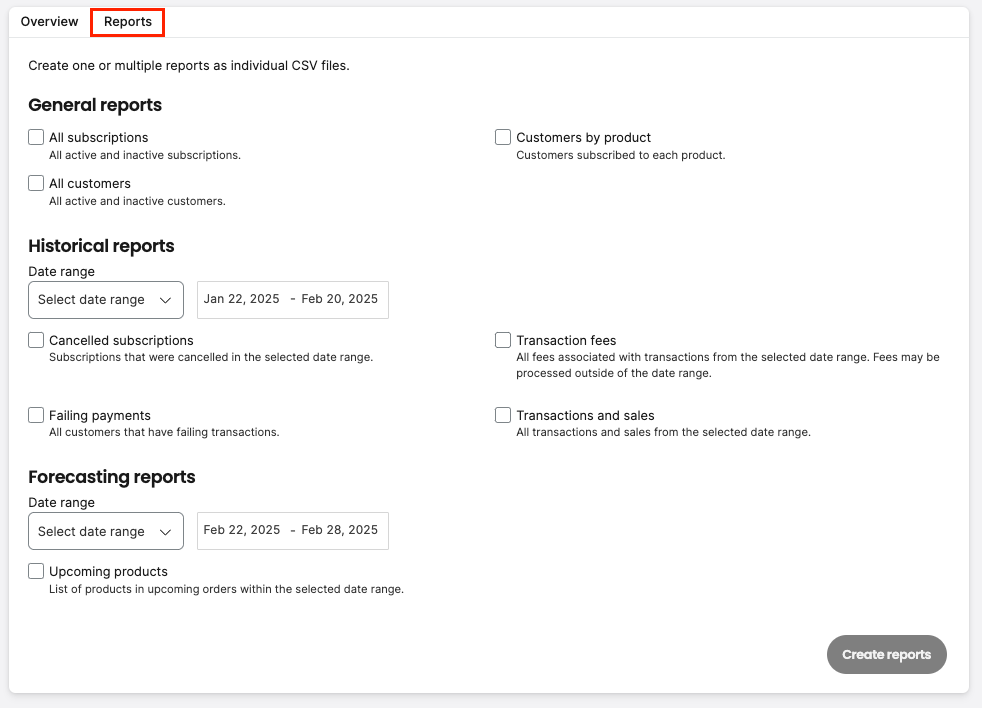
Reports
The Reports section in the Bold Subscriptions' Dashboard page allows you to download a detailed CSV of both your active and inactive subscriptions. This report holds all your individual subscriber data.

General reports
All subscriptions: This report contains subscription information for all of your active and inactive subscriptions on your shop, such as the created date for all subscriptions, the date in which current paused subscriptions were paused on, the next order date for active subscriptions, etc.
All customers: This generates a report which holds all of your customer's information.
Customers by product: This report allows you to see the information for each subscription customer along with the details of their subscription product. This includes the status of their subscription, product variant, quantity, date subscribed, and more.
Historical reports
Cancelled subscriptions: This report contains the subscription information for all your subscriptions cancelled within a specific timeframe. This includes cancellation reasons if you have enabled these within the Cancellation Management settings.
Failing payments: This report shows all your customers with failing transactions along with the reason for the failure, time, subscription I.D, and more.
Transaction fees: This report generates a CSV file outlining all orders within a timeframe along with their transaction fees.
Transactions and sales: This report allows you to see subscription details such as order ID, order amount, shipping, taxes, and more.
Forecasting Reports
Upcoming products: This report allows you to view your scheduled upcoming orders and upcoming products so that you can forecast the amount of inventory you need during a specific date range.
(Optional) Split by quantity: When this option is checked, the report creates a duplicate row for every unit. For example, a row for a product with a quantity of three appears as a quantity of one on three duplicate rows.
Pro-Tip: The date/time fields in your reports are returned with a Universal Coordinated Time (UTC) format. To convert UTC to your store’s time zone, you can use the following formula if the date/time field was in an A1 cell: =DATEVALUE(MID(A1,1,10)) + TIMEVALUE(MID(A1,12,8))
To convert to a different time zone, you can add either add or subtract the time offset. For example, if you’d like to convert UTC to EST, you would add -TIME(5,0,0) to the end of the formula. This looks like: =DATEVALUE(MID(A1,1,10)) + TIMEVALUE(MID(A1,12,8)) - TIME(5,0,0)
Once the formula is applied, you can format the column. Select the column and click Format > Number > Date Time.
Example
Create a report
To create and download a report, please follow the steps below.
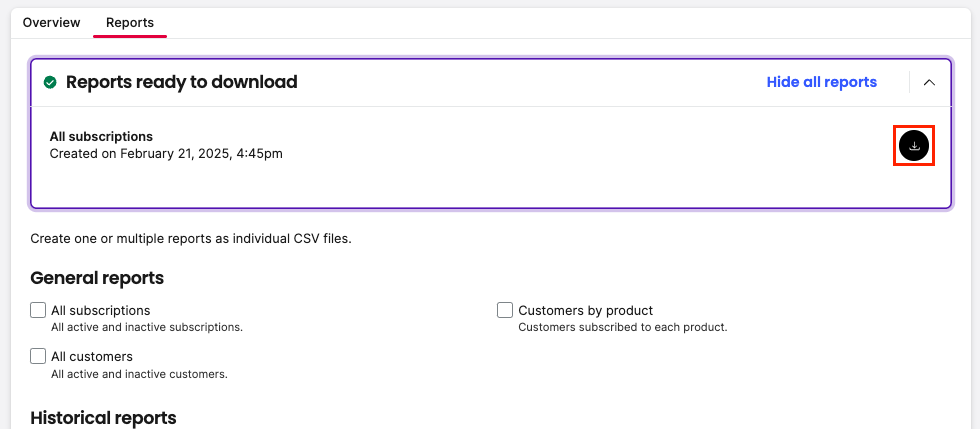
In Bold Subscriptions, click on Reports from the Dashboard page.
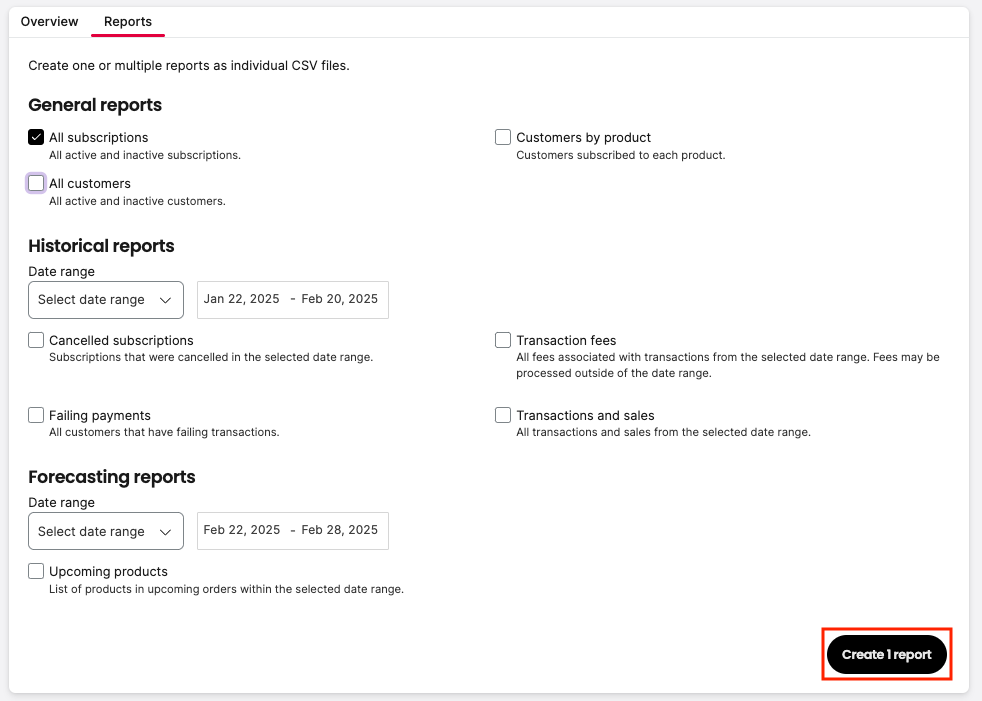
Check the box next to the report you want to generate.
Note: Historical reports require you to enter a Date Range.
Click the Create (x) report(s) button.
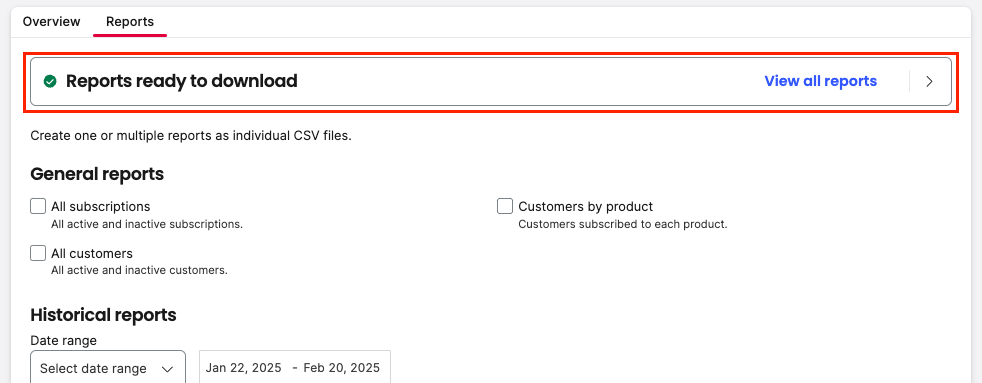
Note: The report can take several minutes to generate.
Click View all reports.
Click the download icon to download your CSV file.
Note: You can access and download your generated reports for 7 days.
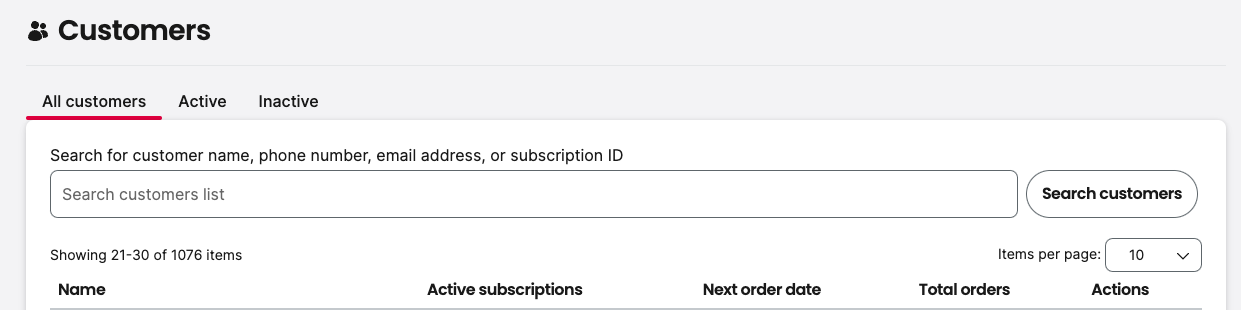
Customers page
The totals shown on the Customers page do not represent subscription numbers. These numbers represent customers who have subscriptions in either an active or inactive state. This number is not likely to match the number of subscriptions as customers can have more than one subscription.
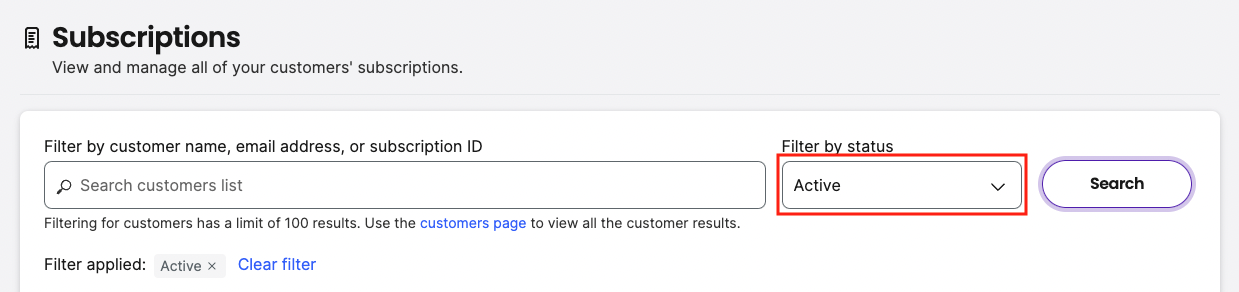
Subscriptions page
On the Subscription page, you can filter by Active subscriptions. This number is accurate as it comes from the database. This number matches what is shown on the dashboard when the paused subscriptions are subtracted.
Activity logs
Within Bold Subscriptions' activity log, you can review a list of events performed by users. This is helpful if you would like to stay informed about events taking place within your subscription business.
Alert: Effective January 31, 2026, Bold will retain activity logs for a rolling period of 18 months.
Logs created within the last 18 months: Will remain accessible as usual in the app admin.
Logs older than 18 months: Will be permanently deleted on a rolling basis.
If you require access to historical subscription activity logs older than 18 months, please speak to a member of our Customer Success team before January 31, 2026.
Using Bold’s activity log, you can find out if a subscription group was updated by an admin, a failed transaction email sent out, whether a customer’s subscription was modified by a customer or a store admin, and more.
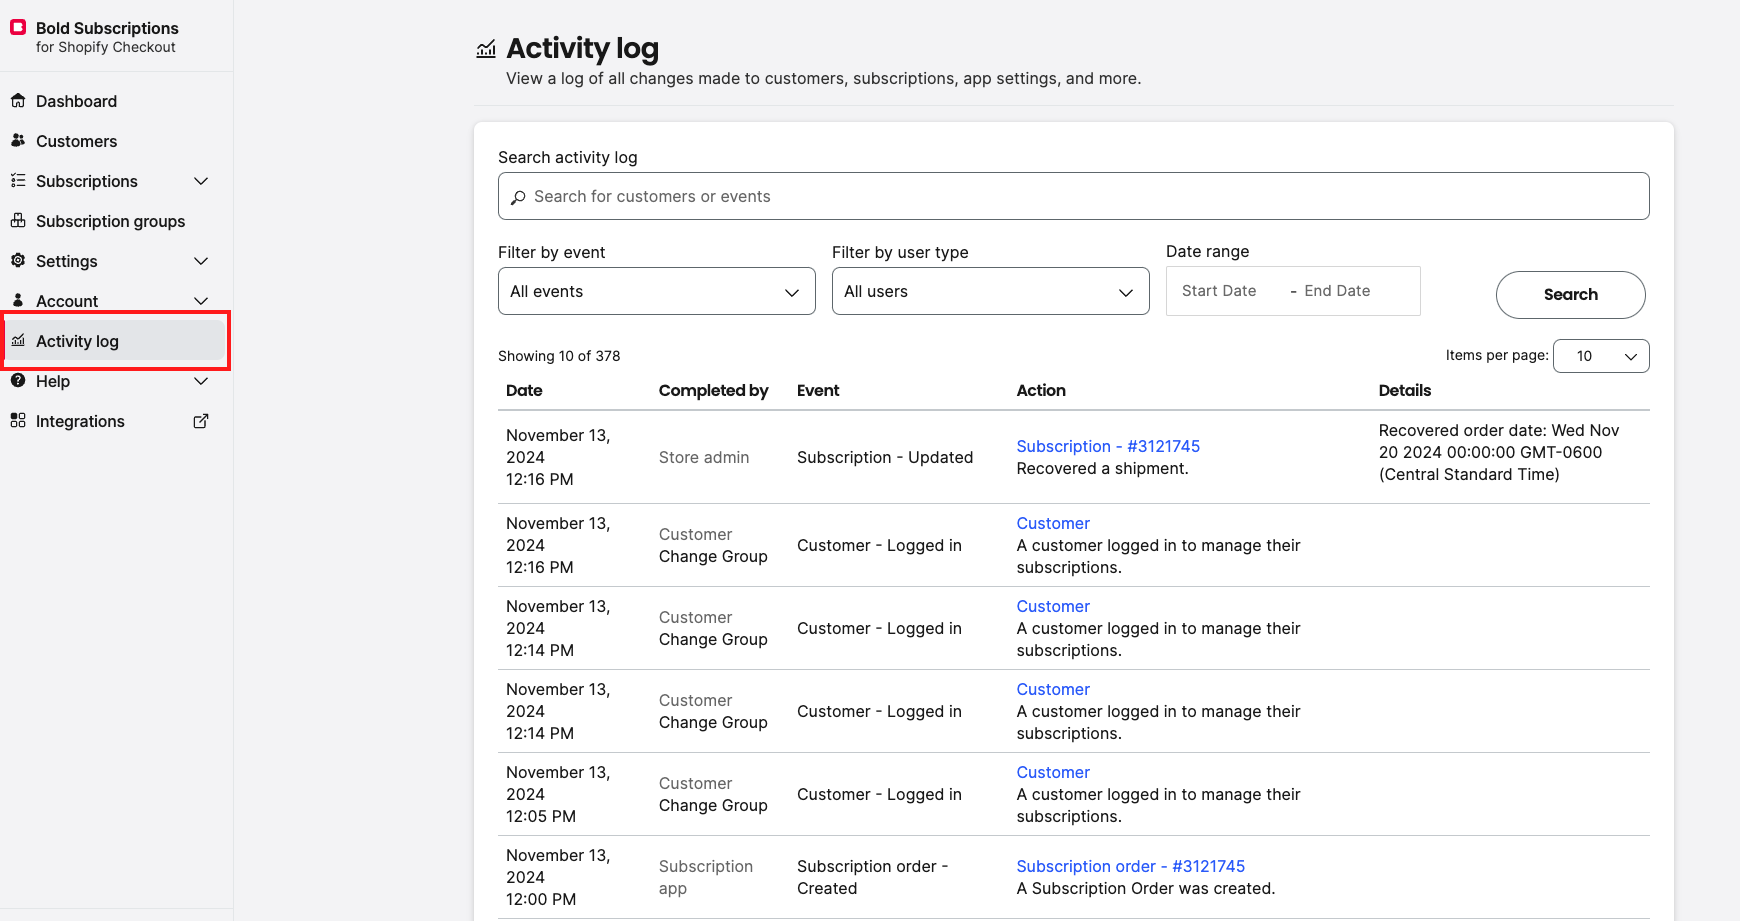
You can search the logs by customer name or event, or use the drop-down menus to filter by event or user type. You can also enter a date range field to narrow your results to a specific time frame.
User Types
All users
Bold admin
Subscription app
Customer
Store admin
Events
Subscription Group - Created
Subscription Group - Updated
Subscription Group - Deleted
Subscription - Created
Subscription - Updated
Subscription - Notification sent
Subscription - Cancelled
Subscription - Failed
Subscription - Paused
Subscription order - Created
Subscription order - Refunded
Subscription order - Refund failed
Shop settings - Updated
Email settings - Updated
Email template - Created
Email template - Updated
Email template - Deleted
Email template - Main template updated
Customer - Created
Customer - Updated
Customer - Logged in
User - Logged in
Shop emails - Updated
Customer address - Created
Customer address - Updated